To maximize your seating capacity, you need to optimize table mix, time slots, and booking strategy based on your actual demand patterns. Restaurants that treat capacity as a system rather than a fixed number typically increase covers by 15-30% without adding seats.
A restaurant can only serve so many guests per night. Capacity planning is the discipline of figuring out exactly what that number is and then systematically filling every available seat without compromising service or guest experience. Get it wrong and you leave money on empty tables. Get it right and you’ve unlocked a predictable, optimized revenue machine.
Key takeaways
- Main solution: Optimize table mix + stagger reservations + strategic overbooking based on data
- Expected result: 15-30% increase in covers from the same space
- Time to implement: 2-4 weeks to gather data, ongoing optimization
- Cost: Free (process changes only)
Before you start
Capacity planning requires understanding your constraints and current performance.
What you’ll need:
- 30-90 days of reservation and seating data
- Your floor plan with table sizes
- Party size distribution from your data
- No-show and cancellation rates by day
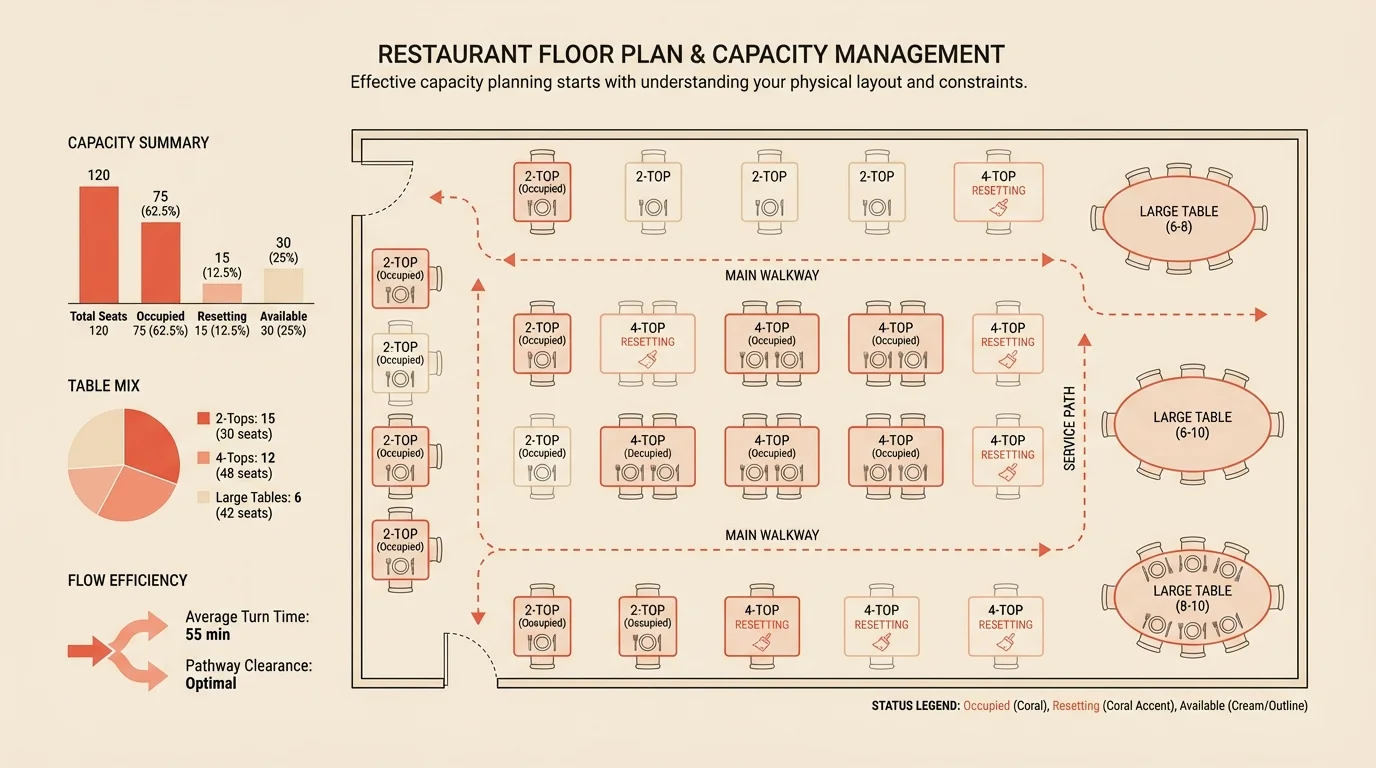
Know your constraints: Capacity isn’t just seat count. It’s the interaction of multiple factors:
- Physical capacity: Total seats, table configurations, flexibility
- Operational capacity: Kitchen output per hour, server coverage, support staff
- Time capacity: Hours of operation, average dining time, reset time
Your true capacity is the lowest of these constraints. A 100-seat restaurant with a kitchen that maxes out at 80 covers per hour has 80-cover capacity during peak demand.
Step 1: Calculate your maximum theoretical capacity
Start by understanding what’s possible before optimizing for reality.
What to do:
- Count your total seats
- Calculate expected turns per service period
- Apply a realistic occupancy rate
- Determine your theoretical maximum
The capacity equation:
For a 60-seat restaurant running dinner service:
- Available seats: 60
- Expected turns: 2.0 (based on historical average)
- Expected occupancy: 90% (accounting for table-party mismatches)
60 x 2.0 x 0.90 = 108 maximum covers
But this is theoretical. Real capacity planning accounts for:
- No-show rate (expect 10% = lose 11 covers)
- Walk-in demand (how many covers come without reservations?)
- Party size variation (3-person party at a 4-top = 1 empty seat)
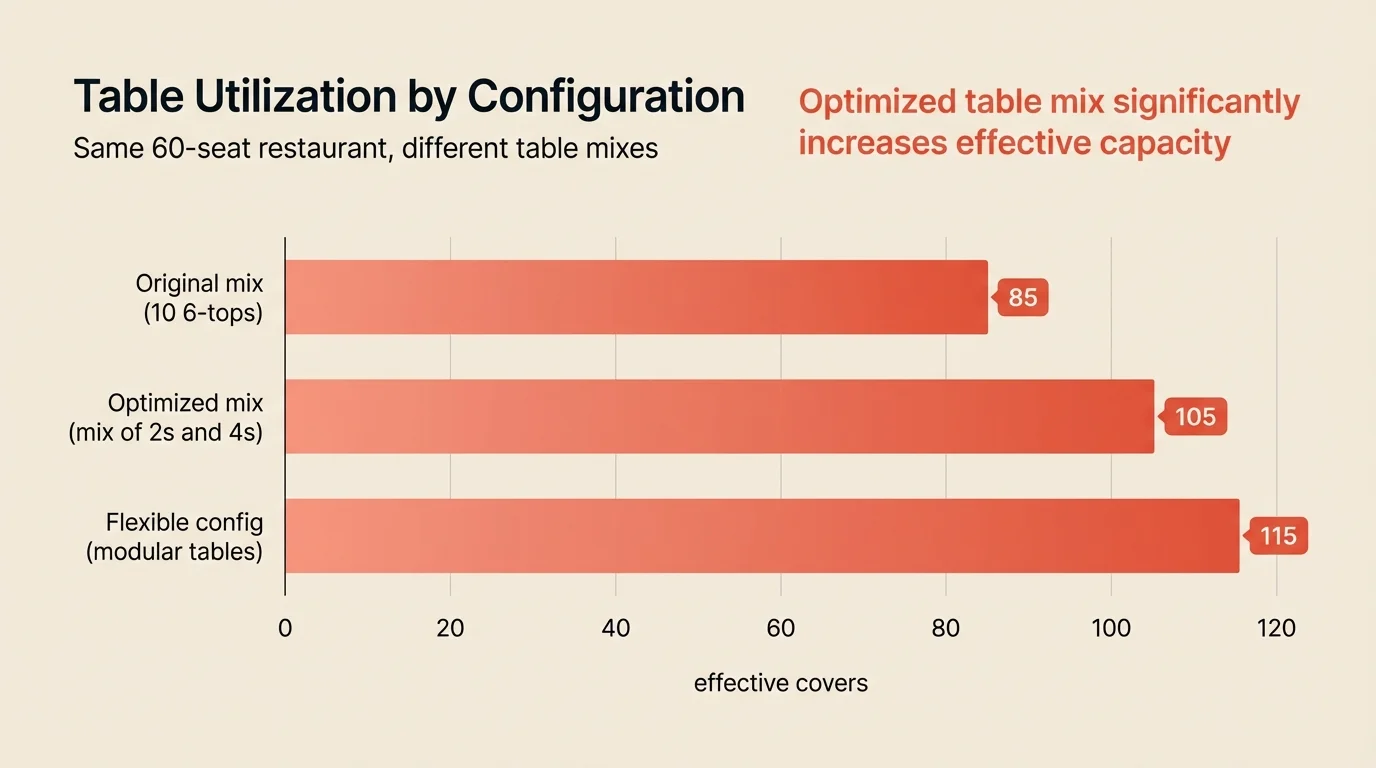
Step 2: Optimize your table mix
Most restaurants have the wrong table mix. Too many large tables, not enough flexibility for the parties they actually serve.
What to do:
- Track party sizes for 2-4 weeks
- Calculate your party size distribution
- Compare to your current table mix
- Adjust configurations to match reality
Track party sizes:
| Party size | % of parties | % of covers |
|---|---|---|
| 1 | 5% | 2% |
| 2 | 45% | 35% |
| 3-4 | 35% | 45% |
| 5-6 | 12% | 15% |
| 7+ | 3% | 3% |
Compare to table mix: If 45% of your parties are 2-tops but only 20% of your tables are 2-tops, you’re constantly seating 2 guests at 4-tops, wasting capacity.
Adjustment options:
- Add more 2-tops
- Use high-top/bar tables for smaller parties
- Invest in flexible tables that can combine or separate
- Create a dedicated small-party section
The goal: minimize empty seats at occupied tables.
Step 3: Stagger reservation times
Booking all 7pm slots at once creates operational chaos. Staggered arrivals smooth kitchen load and improve service.
What to do:
- Spread arrivals across 15-minute intervals
- Match slot length to actual dining time
- Create natural turn points for high-demand periods
- Protect premium time slots
Stagger arrivals: Instead of 20 reservations at 7pm, book:
- 5 at 6:45
- 5 at 7:00
- 5 at 7:15
- 5 at 7:30
Benefits:
- Kitchen tickets spread more evenly
- Servers aren’t slammed simultaneously
- Tables turn at different times, maintaining flow
Match slot length to dining time: If your average dinner takes 75 minutes, don’t book 60-minute slots. You’ll either rush guests or run late on subsequent seatings. Track actual dining times by party size.
Create turn points: For high-demand periods, build natural turn points:
- First seating: 5:30-6:00 arrivals
- Second seating: 7:45-8:15 arrivals
This ensures tables actually turn rather than lingering through prime time.
Step 4: Balance reservations and walk-ins
The right reservation-to-walk-in ratio depends on your concept and demand patterns.
What to do:
- Track walk-in patterns by day and time
- Determine optimal reservation percentage
- Hold capacity for walk-ins on high-demand nights
- Adjust based on results
Walk-in analysis: Before setting policy, know your patterns:
- What percentage of covers are walk-ins?
- What days/times see the most walk-in traffic?
- How often do you turn away walk-ins?
Reservation strategies by situation:
| Day type | Walk-in demand | Strategy |
|---|---|---|
| Slow weeknight | Low | Book 90%+ of capacity |
| Moderate weeknight | Medium | Book 70-80%, hold for walk-ins |
| Busy weekend | High | Book 60-70%, hold 30%+ for walk-ins |
| Peak holiday | Very high | Full reservations with waitlist |
Track your walk-in conversion: If you’re turning away walk-ins regularly, you may be over-booking reservations. If walk-in holds sit empty, release more to reservations.
Step 5: Implement strategic overbooking
If your no-show rate is consistently high, overbooking can recover lost revenue. But do it carefully.
What to do:
- Calculate your historical no-show rate by day
- Start with conservative overbooking (50% of no-show rate)
- Track results for 4 weeks
- Adjust based on actual outcomes
Know your numbers: Track no-show rate by:
- Day of week
- Party size
- Booking source
- Lead time
If Friday dinner runs 12% no-shows and you have 100-cover capacity, you’re losing 12 covers per night.
Start conservative: If no-show rate is 12%, don’t overbook by 12%. Start at 5%:
- Book 105 covers when capacity is 100
- Track outcomes for 4 weeks
- If you never exceed capacity, increase to 7%
- If you frequently exceed capacity, scale back
Have a backup plan: What happens when everyone shows up?
- Waitlist ready to absorb overflow gracefully
- Bar seating available
- Scripts for guests: “Your table will be just a few more minutes”
Overbooking without a backup plan creates angry guests.
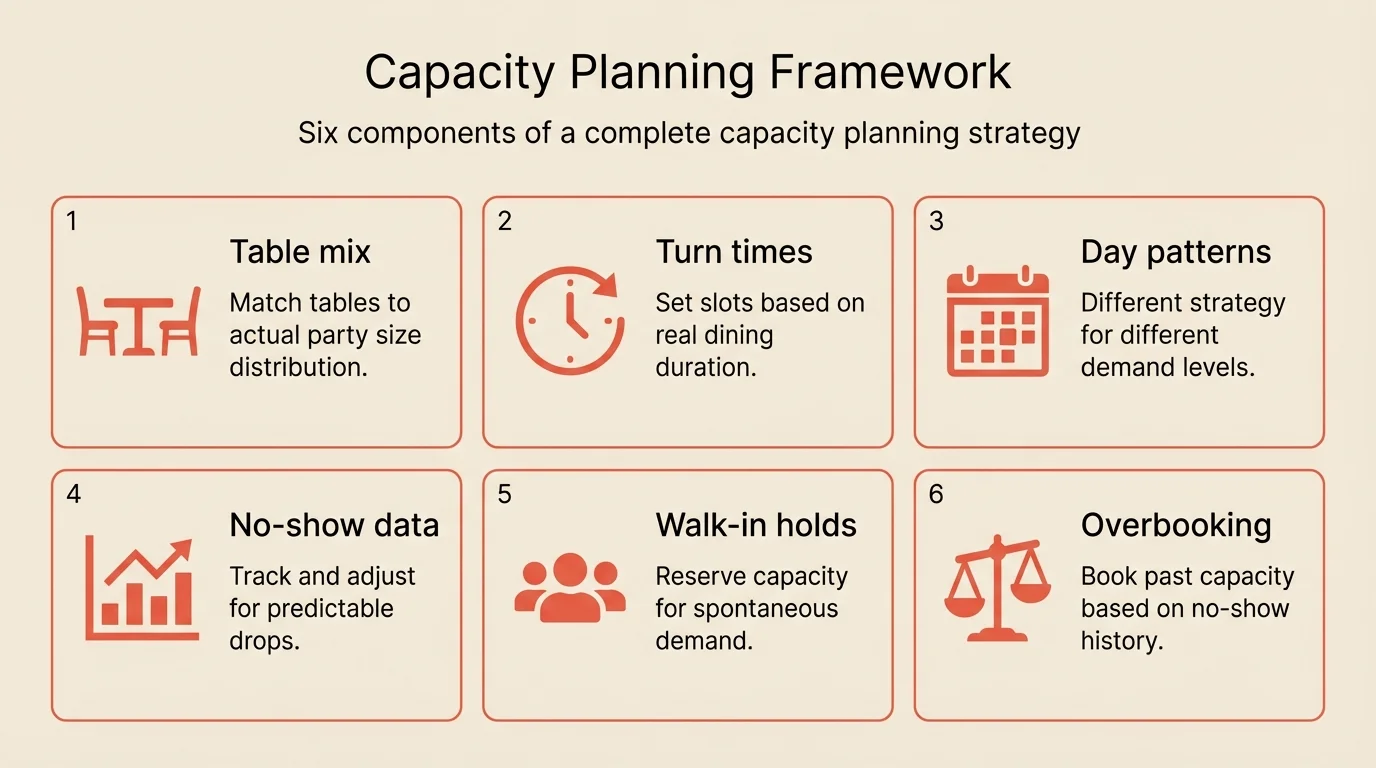
Step 6: Adjust for demand patterns
Capacity strategy should vary by day and season. One size doesn’t fit all.
What to do:
- Segment your week by demand level
- Create different booking strategies for each segment
- Build a capacity calendar for seasonal variations
- Review and adjust monthly
Day-of-week strategies:
| Day | Typical demand | Capacity strategy |
|---|---|---|
| Monday-Wednesday | 50-70% of peak | Book aggressively, fewer walk-in holds |
| Thursday | 70-85% of peak | Moderate walk-in buffer |
| Friday-Saturday | 100%+ | Conservative booking, strategic overbooking |
| Sunday | Varies | Segment by service (brunch vs. dinner) |
Seasonal variation: Holiday periods, local events, and weather all affect demand. Build a capacity calendar that adjusts based on historical patterns.
Booking lead time considerations: Reservations made 2+ weeks out have higher no-show rates. For long-lead bookings:
- Require confirmation closer to date
- Consider deposits for large parties
- Build in higher overbooking buffer
Step 7: Measure and optimize your RevPASH
RevPASH (Revenue Per Available Seat Hour) is the ultimate measure of capacity efficiency.
What to do:
- Calculate your current RevPASH
- Identify your lowest-performing periods
- Target one improvement at a time
- Track weekly and adjust
Calculate RevPASH:
For a 50-seat restaurant that generated $6,000 during a 4-hour dinner service: $6,000 / (50 x 4) = $30 RevPASH
RevPASH by segment: Track RevPASH by:
- Day of week
- Service period (lunch vs. dinner)
- Hour of service
- Table section
This reveals where you’re making money and where capacity sits idle.
Common mistakes to avoid
Treating capacity as fixed
Capacity is the result of table mix, turn times, booking strategy, and demand patterns. All of these can be optimized.
Optimizing for the wrong metric
Total covers doesn’t account for revenue. A 3-turn night with low checks might underperform a 2-turn night with high spending. Use RevPASH.
Ignoring party size efficiency
A 2-top at a 4-top is 50% wasted capacity. Track your actual seat utilization, not just table utilization.
One-size-fits-all booking policy
Tuesday and Saturday need different strategies. High-demand periods justify deposits and shorter booking windows. Slow periods need aggressive filling.
Overbooking without a plan
Overbooking works when you have systems to handle overflow gracefully. Without a waitlist and backup seating, you’ll create disasters.
How to measure success
Track these metrics weekly:
| Metric | Before | Target | How to track |
|---|---|---|---|
| Covers per night | Your baseline | +15-30% | Reservation system |
| RevPASH | Calculate baseline | +20%+ | Revenue / (seats x hours) |
| Seat utilization | Your baseline | 90%+ | Guests seated / seats available |
| Walk-in conversion | Track baseline | 80%+ of holds filled | Walk-ins seated / walk-in capacity |
Tools that help
Modern reservation systems make capacity planning easier with built-in analytics and optimization.
Table management with visual floor plans helps you see utilization and optimize seating in real-time.
Analytics dashboards show covers, RevPASH, and turn times by day and time slot so you can identify opportunities.
Smart overbooking tools track no-show patterns and suggest booking levels automatically.
Waitlist integration provides a safety net for overbooking and captures walk-in demand efficiently.
If your current system doesn’t provide this visibility, Resos includes analytics and table management to support capacity planning.
Frequently Asked Questions
How do I calculate my restaurant's true capacity?
Should I overbook to account for no-shows?
How do I balance reservations and walk-ins?
What's the ideal table mix for my restaurant?
How far in advance should I accept reservations?
The bottom line
Capacity isn’t a fixed number. It’s a system you can optimize. Start by understanding your actual constraints and party size distribution. Adjust your table mix to match reality. Stagger reservations to smooth operations. Implement strategic overbooking based on data.
The restaurants that treat capacity as a manageable system, not a fixed constraint, consistently outperform those that accept their seat count as destiny.
Related guides: Best table management software | Table turnover rate | RevPASH | Waitlist management