To reduce your no-show rate, start with a clean denominator, then test reminders, easy cancellation, and targeted policies. The recorded benchmark in the Resos No-Show Index 2026 is 2.33%, but your own number depends on your booking mix and how consistently your team records outcomes.
An empty table on a busy Friday night is an operational problem. The index found that dinner had a 2.63% recorded rate, 43% higher than lunch, and that late cancellations added another layer of tables that were difficult to resell.
Key takeaways
- Main solution: Track no-shows by day/party size + automated reminders + easy cancellation + deposits for high-risk bookings
- Expected result: A measurable baseline and a clearer view of where no-shows happen
- Time to implement: 1-2 hours for initial setup
- Cost: Free with most reservation systems
Before you start
You can’t improve what you don’t measure. Start by calculating your current no-show rate.
What you’ll need:
- Reservation data from the last 30-90 days
- Access to your reservation system’s reporting
- Ability to tag or track no-shows going forward
Calculate your baseline:
If you had 200 eligible reservations and 4 recorded no-shows, your recorded rate is 2%.
Break it down further:
- Day of week (Fridays often see higher no-shows than Tuesdays)
- Booking lead time (the index’s highest rate was 2 to 6 days ahead)
- Party size (large parties had a lower rate in the index, but more covers at stake)
- Booking source (third-party platforms may have different rates)
The patterns tell you where to focus your prevention efforts.
Step 1: Calculate your monthly cost
Understanding the financial impact motivates action and helps justify prevention investments.
What to do:
- Pull your eligible no-show count from a stable period
- Multiply no-show covers by your average check
- Track late cancellations separately because they may still be backfilled
- Compare the estimate with your actual waitlist recovery
The calculator uses your own covers and average check to model an estimate. It is not a first-party revenue-loss benchmark.
Step 2: Test automated reminders
Reminders are one workflow to test. Include a clear way to confirm or cancel, then compare the result with a stable baseline.
What to do:
- Turn on SMS reminders in your reservation system
- Set timing: 24 hours before (add 48-hour for weekends)
- Include confirm and cancel links
- Track response rates
Reminder content:
- Date, time, party size
- Restaurant name and address
- One-click confirm button
- One-click cancel button
SMS vs. email: In the index, reservations with a delivered SMS reminder had a 16% lower recorded rate than reservations at the same restaurants without one. That is an association, not a causal result. Test delivered reminders against your own baseline.
Step 3: Add confirmation requests
You can ask guests to confirm as part of the workflow. Track responses and non-responses consistently before deciding whether to change follow-up.
What to do:
- Send confirmation requests 48-72 hours before
- Use action language: “Please confirm your reservation”
- Set up follow-up for non-responders
- Release tables from guests who don’t respond
Confirmation flow:
- 48-72 hours before: Send confirmation request
- 24 hours before: Follow up with non-responders
- If still no response: Call or release table with notice
What good looks like:
- Confirmation response rate tracked consistently over time
- Non-confirming reservations flagged for follow-up
- Problem bookings identified with enough notice to act
Step 4: Make cancellation frictionless
Make cancellation easy to record and review. This gives guests a clear alternative to missing the reservation, but the effect should be measured against your own baseline rather than assumed.
What to do:
- Include one-click cancel in every reminder
- Don’t require phone calls during service hours
- Send a brief confirmation when cancelled
- Trigger your rebooking process immediately
What to measure: Track the share of guests who use the cancellation link, the share who cancel late, and the share recorded as no-shows. Compare those outcomes with the period before the link was introduced.
Step 5: Implement strategic deposits
Deposits change the booking conditions, but their observed rates can reflect selection bias. Use them where the operational risk justifies the guest friction, then compare the result with a stable baseline.
What to do:
- Identify high-risk bookings (large parties, peak times, special occasions)
- Set an amount and refund window that fit your restaurant and local rules
- Make deposits refundable within your cancellation window
- Apply deposits to the final bill
When to require deposits:
- Large parties (6+ guests)
- Friday and Saturday prime time
- Holidays (Valentine’s Day, Mother’s Day, New Year’s Eve)
- Guests with previous no-show history
For a detailed guide on implementing deposits, see prepayments and deposits.
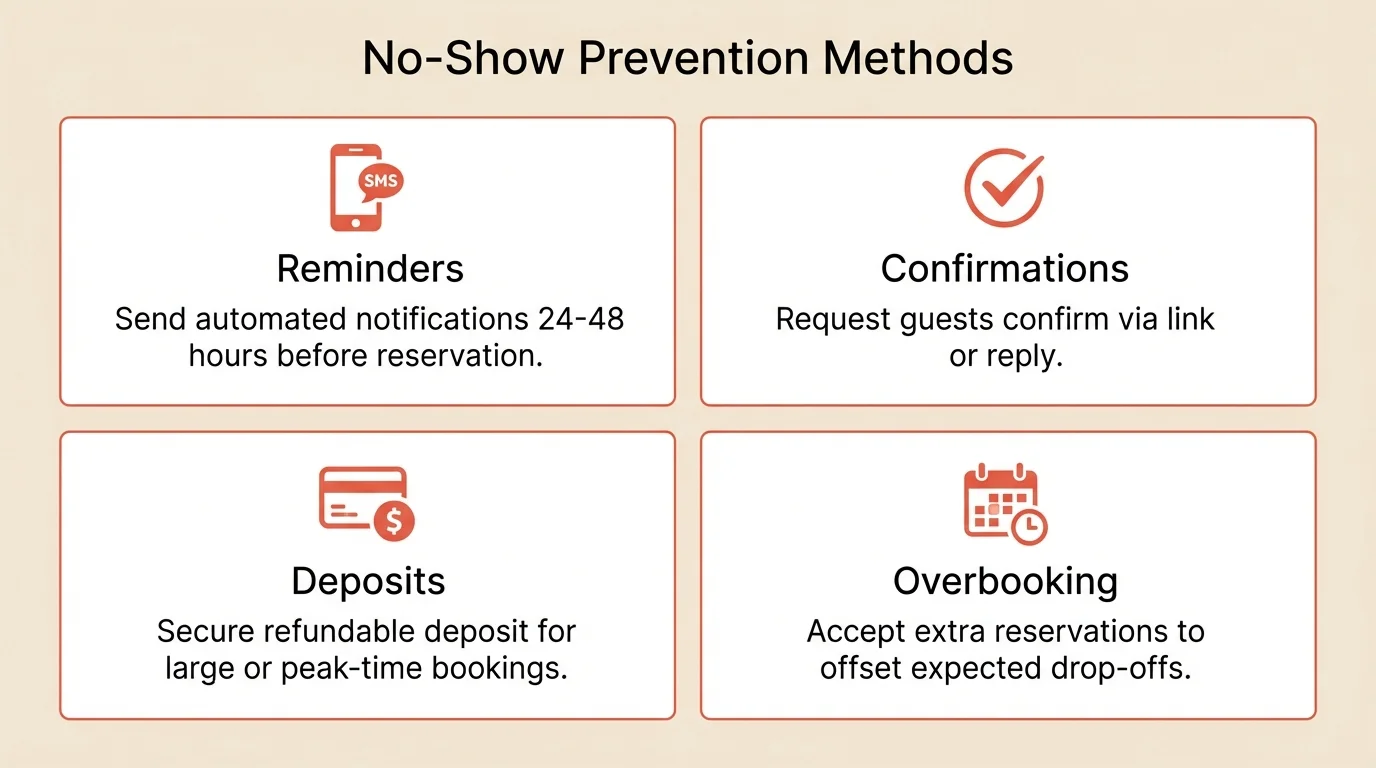
Step 6: Consider strategic overbooking
If your no-show rate is consistently high, a carefully modelled capacity buffer may help recover some released capacity. Treat it as an operational test, not a guaranteed result.
What to do:
- Calculate your historical no-show rate by day
- Start conservatively from your own measured rate
- Track results for 4 weeks before adjusting
- Have a backup plan when everyone shows
How it works: If your data shows a stable pattern, model a small capacity buffer and test it against your waitlist and table layout. A benchmark from another restaurant is not enough to decide how far to overbook.
Backup plan:
- Waitlist ready to absorb overflow gracefully
- Bar seating available
- Scripts for guests: “Your table will be just a few more minutes”
For more on overbooking strategy, see capacity planning.
Step 7: Track patterns and repeat offenders
Not all no-shows are equal. Some guests are chronic offenders who cost you money repeatedly.
What to do:
- Tag all no-shows in your system
- Track by guest to identify repeat patterns
- Flag chronic no-shows for special handling
- Review patterns weekly
Handling repeat offenders:
- First offense: Note in system, no action
- Second offense: Require deposit for future bookings
- Third offense: Polite conversation about the impact
- Chronic pattern: Consider declining future reservations
Common mistakes to avoid
Not tracking the right data
Overall no-show rate isn’t enough. Break it down by day, time, party size, and source. The patterns reveal where to focus.
Making cancellation too hard
Trapping guests doesn’t work. They’ll ghost you instead. Make cancelling as easy as booking.
Applying deposits to everything
Deposits for Tuesday lunch at a half-empty restaurant creates friction without benefit. Target high-risk scenarios only.
Overbooking without a plan
Overbooking requires a clear process for overflow, including a waitlist and backup seating. Model it from your own data and review the guest experience as well as the booking data.
Ignoring the underlying patterns
If one service has a materially different rate, investigate the booking source, lead time, party mix, and recording process before changing policy.
How to measure success
Track these metrics weekly:
| Metric | Before (example) | Target | How to track |
|---|---|---|---|
| Overall no-show rate | Your baseline | Improve or stabilize | No-shows / eligible reservations |
| Late cancellation share | Your baseline | Reduce or backfill more | Late cancellations / cancellations |
| Confirmation response rate | Your baseline | Monitor trend | Responses / requests |
| Waitlist recovery | Your baseline | Improve recovery | Backfilled tables / released tables |
Model potential exposure:
This is a local planning model, not an industry revenue-loss figure or a forecast.
Tools that help
Modern reservation systems handle most no-show prevention automatically.
SMS and email reminders send messages at the right times with one-click confirm and cancel buttons.
Deposit collection with built-in payment processing makes collecting and applying deposits seamless.
Guest history tracking flags repeat no-shows and lets you require deposits or have conversations before problems recur.
Analytics show no-show rates by day, time, party size, and source so you can identify patterns.
If your current system lacks these features, compare platforms by the controls they provide, how clearly guests can cancel, and whether your team can measure the result.
Frequently Asked Questions
What is a good no-show rate for restaurants?
How much do no-shows actually cost my restaurant?
Should I charge a no-show fee?
Do SMS reminders actually reduce no-shows?
How do I track no-show repeat offenders?
The bottom line
No-show rate is a useful operating metric when the denominator is clear. Start by calculating your current rate and tracking late cancellations separately. The index found a 2.63% dinner rate versus 1.84% at lunch, but your own service pattern should guide the next change.
Add confirmation requests, easy cancellation, and strategic deposits for high-risk bookings. Track patterns to identify problem areas and repeat offenders.
The restaurants that treat no-show rate as a measurable process can make better decisions about reminders, policies, and waitlist recovery.
Related guides: How to reduce no-shows | Prepayments and deposits | Capacity planning