To improve RevPASH, you need to optimize occupancy, turnover, and average check together rather than focusing on any single metric. Restaurants that track and improve RevPASH typically increase revenue by 15-25% from the same physical space.
Your restaurant has 50 seats and did $8,000 in revenue on Friday night. Good or bad? Impossible to say without knowing how long you were open and how many seats actually generated that revenue. RevPASH answers that question and reveals whether you’re maximizing your space or leaving money on empty chairs.
Key takeaways
- Main solution: Track RevPASH by hour/day, then optimize occupancy, turnover, and check together
- Expected result: 15-25% revenue increase from same physical space
- Time to implement: 1-2 hours for initial calculation, ongoing tracking
- Cost: Free (measurement and process optimization)
Before you start
Understanding RevPASH requires pulling together revenue, capacity, and time data.
What you’ll need:
- Revenue data by service period
- Your total seat count
- Hours of operation per service period
- Historical data for comparison (ideally 4+ weeks)
Know your baseline: Before optimizing, calculate where you stand today. You’ll track improvement from this starting point.
Step 1: Calculate your current RevPASH
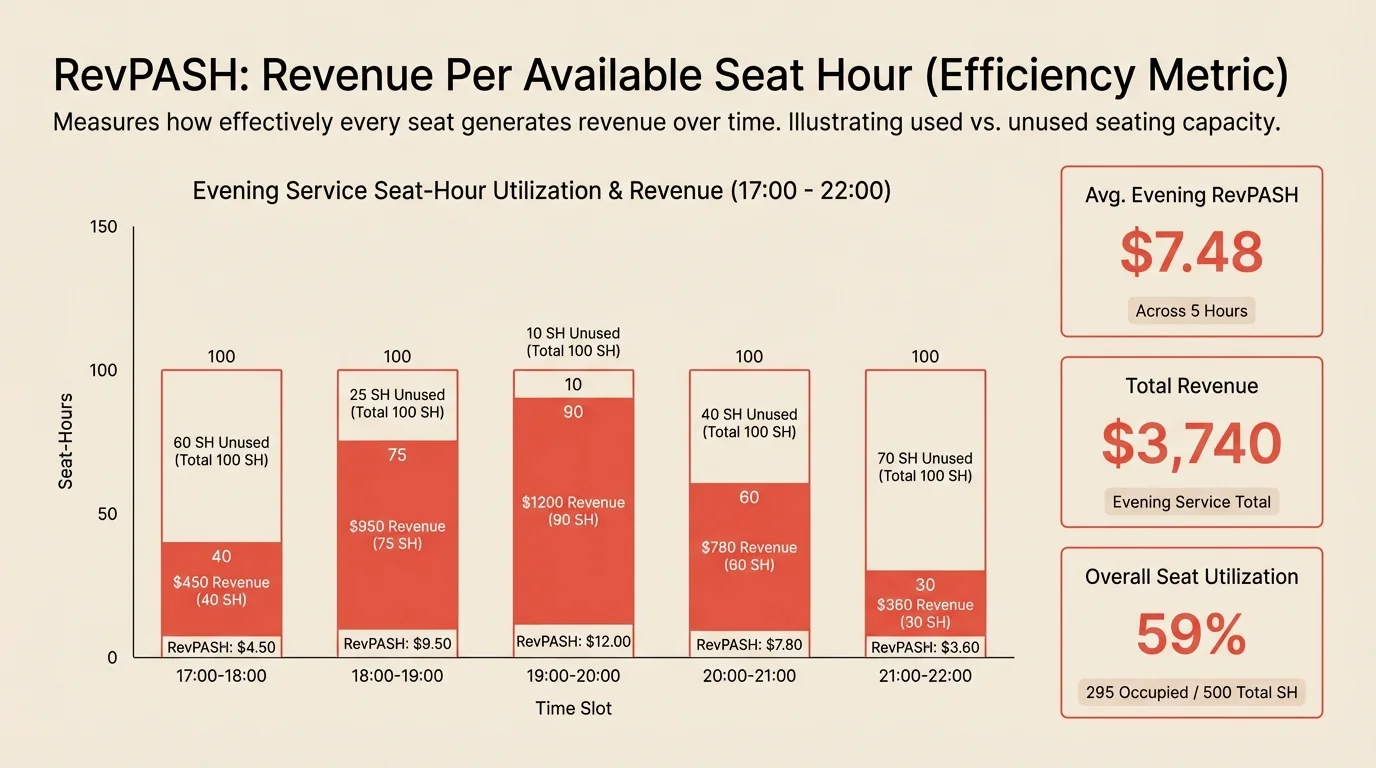
RevPASH (Revenue Per Available Seat Hour) combines your revenue, capacity, and operating hours into a single efficiency metric.
What to do:
- Pull total revenue for a service period
- Count your available seats
- Determine hours of operation for that period
- Apply the formula
The formula:
Example calculation: For a 50-seat restaurant that generated $6,000 during a 4-hour dinner service:
$6,000 / (50 seats x 4 hours) = $30 RevPASH
That means each seat produced $30 per hour of revenue, on average.
Pro tip: Calculate RevPASH for multiple periods to establish your baseline and identify patterns.
Step 2: Break down RevPASH by segment
Averages hide important details. Drilling down reveals where you’re making money and where capacity sits idle.
What to do:
- Calculate RevPASH by day of week
- Calculate RevPASH by service period (lunch vs. dinner)
- Calculate RevPASH by hour
- Calculate RevPASH by section (bar, dining room, patio)
Hourly analysis example:
| Hour | Occupancy | Avg check | RevPASH |
|---|---|---|---|
| 5:00pm | 40% | $55 | $8.80 |
| 6:00pm | 75% | $62 | $18.60 |
| 7:00pm | 100% | $78 | $31.20 |
| 8:00pm | 95% | $82 | $31.16 |
| 9:00pm | 60% | $70 | $16.80 |
What this reveals:
- 7pm and 8pm generate nearly 4x the RevPASH of 5pm
- The 5pm hour may need targeted promotions
- Heavy staffing should focus on 7-8pm
Step 3: Understand what moves RevPASH
RevPASH is a composite metric controlled by three levers. Understanding their interaction helps prioritize improvements.
What to do:
- Identify which lever is your biggest opportunity
- Diagnose why that lever is underperforming
- Target improvements to that specific lever
- Track impact on overall RevPASH
The three levers:
| Lever | What it is | How to improve |
|---|---|---|
| Occupancy | Seats filled / seats available | Fill slow periods, reduce no-shows |
| Turnover | Parties served / tables | Faster resets, streamlined payment |
| Average check | Revenue / guests | Upselling, menu optimization |
Key insight: These levers interact. A 15% check increase that adds 20 minutes to dining time might actually decrease RevPASH during peak periods. Know your numbers before pushing check averages.
Step 4: Improve occupancy
Empty seats earn zero. Every unfilled seat during operating hours drags down RevPASH.
What to do:
- Identify your lowest-occupancy periods
- Understand why those periods underperform
- Test targeted solutions
- Measure impact on RevPASH
Occupancy improvement strategies:
| Strategy | Best for | Impact |
|---|---|---|
| Waitlist management | Filling cancellations | Immediate |
| Strategic overbooking | High no-show rate periods | Immediate |
| Slow period promotions | Consistent low-occupancy times | Medium-term |
| Bar seating for walk-ins | Peak periods | Immediate |
Slow period tactics:
- Early bird prix fixe before 6pm
- Industry night specials on slow weekdays
- Chef’s menu available only Tuesday-Thursday
- Email campaigns to past guests for specific days
For more on filling slow periods, see how to get more reservations.
Step 5: Improve turnover
Faster turns mean more revenue opportunities per seat per hour. Focus on eliminating dead time, not rushing the dining experience.
What to do:
- Time your current guest journey phases
- Identify where time is wasted
- Eliminate friction in those areas
- Track turn time improvement
Turnover improvement strategies:
| Area | Typical time lost | Solution |
|---|---|---|
| Table reset | 5-10 min | Dedicated busser, pre-staging |
| Payment processing | 10-15 min | Tableside terminals |
| Seating delays | 5-10 min | Real-time table status tracking |
| Kitchen backup | Variable | Stagger reservations |
Highest-impact improvement: Payment processing is often the single biggest turnover killer. Tableside terminals can cut 10+ minutes per table without guests feeling rushed.
For detailed turnover optimization, see table turnover rate.
Step 6: Optimize average check
Higher checks increase RevPASH directly. But check-building takes time, which can hurt turnover during peaks. Balance is key.
What to do:
- Analyze check averages by server, time, and party size
- Train staff on natural upselling
- Optimize menu for check-building opportunities
- Monitor impact on dining time
Check-building strategies:
| Strategy | Impact on check | Impact on time |
|---|---|---|
| Drink suggestions | +$8-15/table | Minimal |
| Appetizer prompts | +$15-25/table | +10-15 min |
| Dessert suggestions | +$10-20/table | +15-20 min |
| Premium upgrades | +$5-15/guest | None |
Peak vs. off-peak: During peak hours when you have a waitlist, focus on turnover over check-building. During slow periods, maximize check since you’re not turning away guests.
Step 7: Track RevPASH weekly
Consistent tracking reveals trends and the impact of changes.
What to do:
- Calculate RevPASH for each service period weekly
- Compare to baseline and prior weeks
- Note any changes you made and their impact
- Adjust strategy based on results
Weekly tracking example:
| Day/Period | Covers | Revenue | Hours | RevPASH | vs. Baseline |
|---|---|---|---|---|---|
| Mon dinner | 45 | $2,250 | 4 | $12.50 | -15% |
| Tue dinner | 52 | $2,860 | 4 | $14.30 | -3% |
| Wed dinner | 68 | $3,740 | 4 | $18.70 | +27% |
| Thu dinner | 75 | $4,125 | 4.5 | $18.33 | +24% |
| Fri dinner | 98 | $5,880 | 5 | $23.52 | +60% |
| Sat dinner | 105 | $6,825 | 5 | $27.30 | +85% |
| Sun dinner | 62 | $3,410 | 4 | $17.05 | +16% |
What to look for:
- Consistent underperformers (focus your improvements here)
- Impact of changes you’ve made
- Seasonal or event-driven variations
- Differences between sections
Common mistakes to avoid
Ignoring time in the equation
Total revenue doesn’t account for how long you were open or how efficiently you used your hours. A restaurant that does $5,000 in 3 hours outperforms one that does $6,000 in 5 hours.
Optimizing one variable in isolation
Chasing high checks without watching turnover, or maximizing turns at the expense of check average. RevPASH forces integrated thinking.
Using overall averages
Your aggregate RevPASH hides massive variation by hour, day, and section. Drill down to find the real opportunities.
Forgetting opportunity cost
A 4-top occupied by 2 guests isn’t a full table. It’s two empty seats hurting your RevPASH. Right-size seating to minimize this waste.
Tracking but not acting
RevPASH is useful only if it drives decisions. Identify your lowest-performing period. Make one change. Measure the result. Repeat.
How to measure success
Track these metrics weekly:
| Metric | Before | Target | How to track |
|---|---|---|---|
| Overall RevPASH | Your baseline | +15-25% | Revenue / (seats x hours) |
| Peak period RevPASH | Your baseline | +10% | Same formula, peak hours only |
| Slow period RevPASH | Your baseline | +30%+ | Same formula, off-peak hours |
| Seat utilization | Track baseline | 90%+ | Guests / available seats |
Calculate the revenue impact:
For a 50-seat restaurant open 4 hours/night, 6 nights/week:
- Improving RevPASH from $25 to $30 = $5 increase
- $5 x 50 seats x 4 hours x 24 nights = $24,000/month
That’s the power of RevPASH optimization.
Tools that help
Modern reservation systems provide the data you need to track and improve RevPASH.
Analytics dashboards show revenue, covers, and turn times by day and time slot so you can calculate RevPASH easily.
Table management helps you see utilization in real-time and match parties to tables efficiently.
Waitlist integration fills cancelled reservations immediately, protecting occupancy.
Reporting exports let you build RevPASH tracking spreadsheets with your historical data.
If your current system doesn’t provide revenue-by-period reporting, Resos includes analytics that support RevPASH tracking.
Frequently Asked Questions
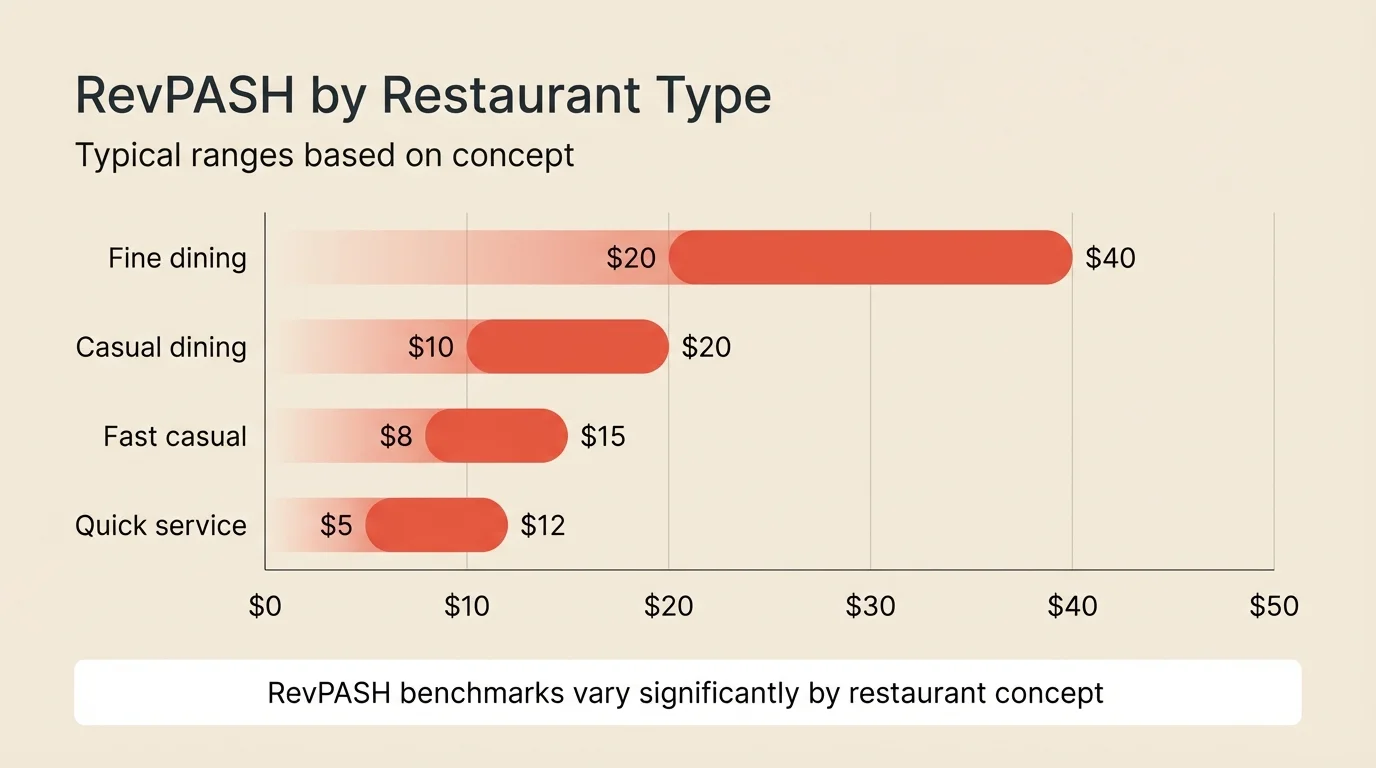
What is a good RevPASH for restaurants?
How is RevPASH different from average check?
Should I focus on RevPASH or table turnover?
Can RevPASH help with staffing decisions?
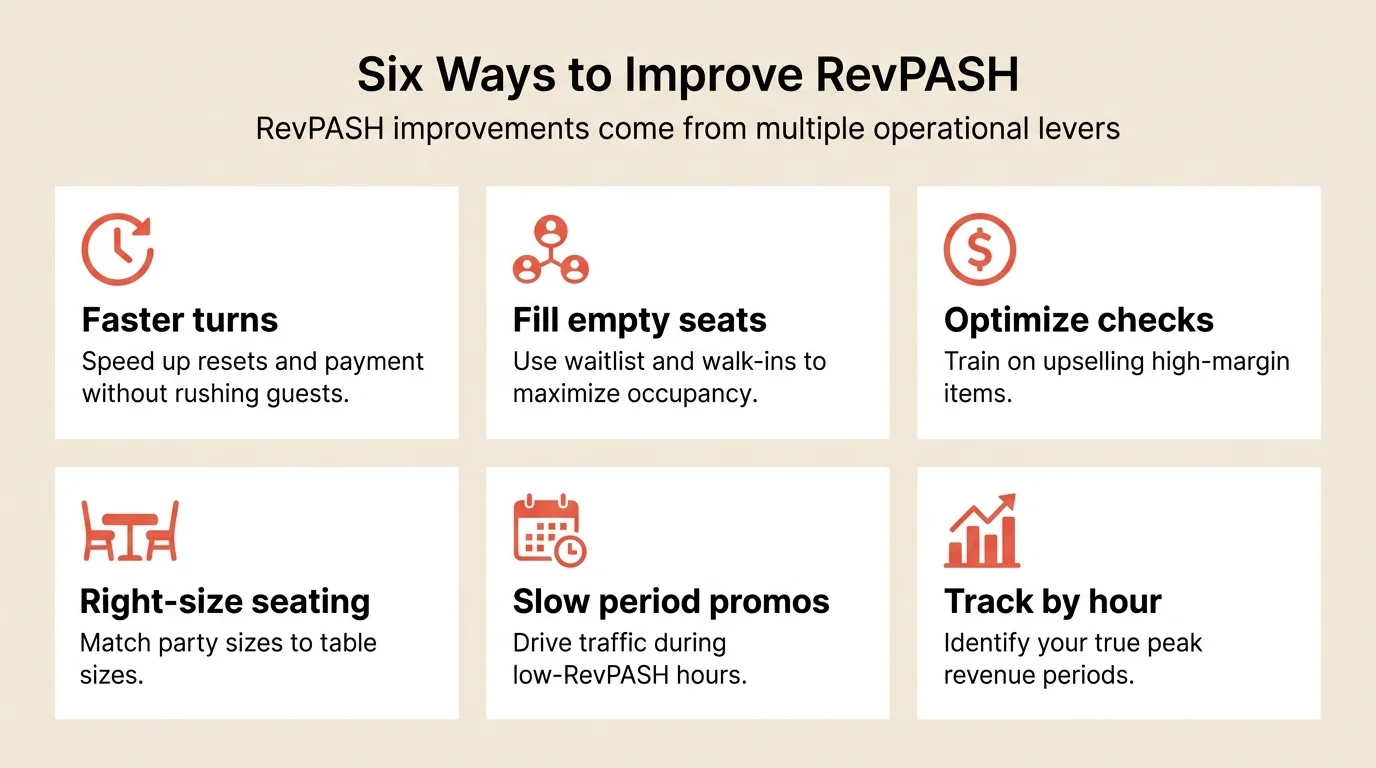
What's the fastest way to improve RevPASH?
The bottom line
RevPASH is the most complete picture of how well your physical space generates revenue. It combines occupancy, turnover, and check average into a single number that reveals true efficiency.
Start by calculating your baseline. Break it down by hour, day, and section to find your biggest opportunities. Then improve one lever at a time: fill slow periods, speed up turns, or optimize checks. Track weekly to see what’s working.
The restaurants that track RevPASH consistently find opportunities invisible to those watching only covers or checks.
Related guides: Table turnover rate | Capacity planning | How to get more reservations